반응형
matplotlib.pyplot
pie chart
기본 생성
import matplotlib.pyplot as plt

labels = ['Python', 'C#', 'Java', 'C/C++', 'Swift']
points = [30, 20, 30, 10, 10]

plt.title('Langeuage usages')
plt.pie(points, labels=labels, autopct='%.1f%%', counterclock=False, startangle=90)
plt.show()
- startangle : 차트의 시작. 위 예에서는 90도 방향에서 시작하도록 했습니다.
- counterclock : False 일 경우 시계 방향으로 표시
색상 변경
colors 에 색상 list 를 넘겨주면 됩니다. labels 사이즈에 맞출 필요는 없어보입니다.
    colors = ['#c1abff', '#d8e1c5', '#80afe5', '#ddadd0', '#ebbfea', '#84cec0', '#9acee9', '#d6c2b6', '#d48c9d', '#dcf6c5']
    labels = ['Python', 'C#', 'Java', 'C/C++', 'Swift']
    points = [30, 20, 30, 10, 10]

    plt.title('Langeuage usages')
    plt.pie(points, labels=labels, autopct='%.1f%%', counterclock=False, startangle=90, colors=colors)
    plt.show()
Explode 옵션
explode : 특정 파이를 나오게 하는 옵션입니다.
    colors = ['#c1abff', '#d8e1c5', '#80afe5', '#ddadd0', '#ebbfea', '#84cec0', '#9acee9', '#d6c2b6', '#d48c9d', '#dcf6c5']
    labels = ['Python', 'C#', 'Java', 'C/C++', 'Swift']
    points = [30, 20, 30, 10, 10]
    explode = [0.1, 0, 0.05, 0, 0]

    plt.title('Langeuage usages')
    plt.pie(points, labels=labels, autopct='%.1f%%', counterclock=False, startangle=90, colors=colors, explode=explode)
    plt.show()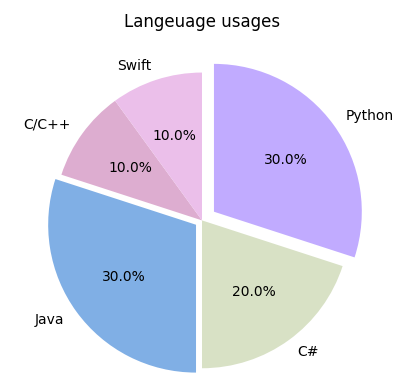
Shadow
shadow=False 가 기본값입니다. True 로 바꿔주면
plt.pie(points, labels=labels, autopct='%.1f%%', counterclock=False, startangle=90, colors=colors, explode=explode,
        shadow=True)
wedgeprops
wedgeprops = {'width': 0.7, 'edgecolor': 'w', 'linewidth': 1}

plt.pie(points, labels=labels, autopct='%.1f%%', counterclock=False, startangle=90, colors=colors, explode=explode,
        shadow=True,
        wedgeprops=wedgeprops)
이미지로 저장하기
plt.savefig(path)
plt.savefig('./images/my_pie_chart.png')입력한 경로에 폴더가 없으면 오류가 발생합니다.
- [Python] matplotlib.pyplot 을 이용해서 bar(막대) chart 만들기
- [Python] matplotlib.pyplot 을 이용해서 pie chart 이미지로 만들기
- [Python] matplotlib.pyplot 을 이용해서 line chart 만들기
728x90
반응형
'Python' 카테고리의 다른 글
| [Python] [Streamlit 사용법] 3. button (0) | 2022.02.22 |
|---|---|
| [Python] matplotlib.pyplot 을 이용해서 line chart 만들기 (0) | 2022.02.20 |
| [Python] [Streamlit 사용법] 2. input_text (0) | 2022.02.17 |
| [Python] [Streamlit 사용법] 1. 설치 및 hello world~ (0) | 2022.02.17 |
| [Python] matplotlib.pyplot 을 이용해서 bar(막대) chart 만들기 (0) | 2022.02.16 |


댓글